Name | Definition |
|---|---|
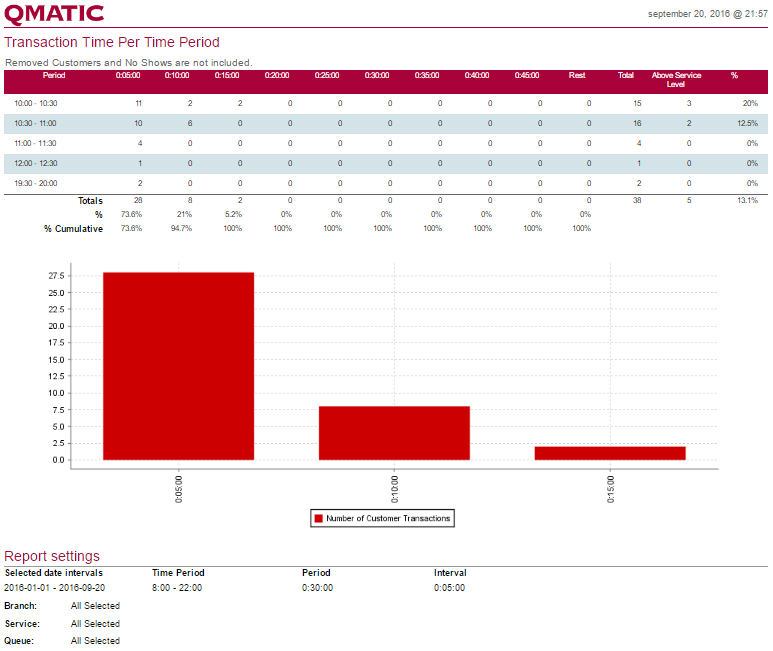
Period | The start and end time for the period. The period length is specified in the parameters. The report shows transactions that started during the period. For example, a transaction that started 8:25 and ended 8:35 will be placed in the 8:00 - 8:30 period. The period shows transactions that started at the same time as the period start time and until, but not including, the period end time. |
Intervals (00:05:00, 00:10:00, …) | The time intervals as defined by the Interval parameter. The report presents the number of transactions with a transaction time within the interval. The shown time is the end of the interval. |
Rest | These are all transactions with a transaction time above the last interval, in this example above 45 minutes. |
Total | The total number of transactions. |
Above service level | The number of transactions that took longer than the Service Level defined in the Service settings, in Orchestra. |
Above service level % | The percentage of total transactions that took longer than the Service Level defined in the Service settings in Orchestra. |
Total | The total number of transactions within each interval. |
% | The percentage of all transactions that were within the interval. |
% Cumulative | The percentage of all transactions that were within this and all previous intervals (percentage that had a transaction time up to and including this interval). |