Name | Definition |
|---|---|
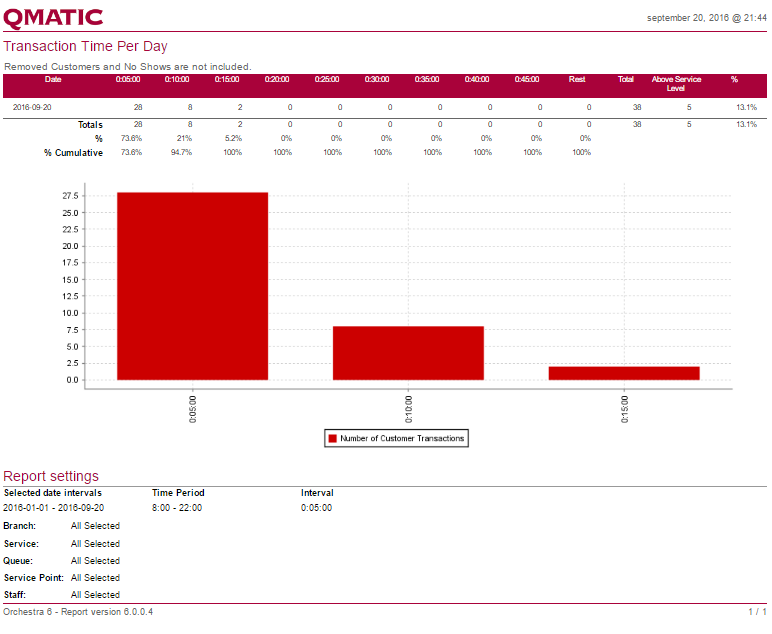
Month | Shows Day, Week, Month, Year or Weekday, depending on the View parameter. |
Intervals (00:05:00, 00:10:00, …) | The time intervals, as defined by the Interval parameter. The report presents the number of transactions with a transaction time within the interval. The shown time is the end of the interval. |
Rest | These are all transactions with a transaction time above the last interval. |
Total | The total number of transactions. |
Above service level | The number of transactions that took longer than the Service Level, defined in the Service settings in Orchestra. |
Above service level % | The percentage of total transactions that took longer than the Service Level, defined in the Service settings in Orchestra. |
Total | The total number of transactions within each interval. |
% | The percentage of all transactions that were within the interval. |
% Cumulative | The percentage of all transactions that were within this and all previous intervals (percentage that had a transaction time up to and including this interval). |