Name | Definition |
|---|---|
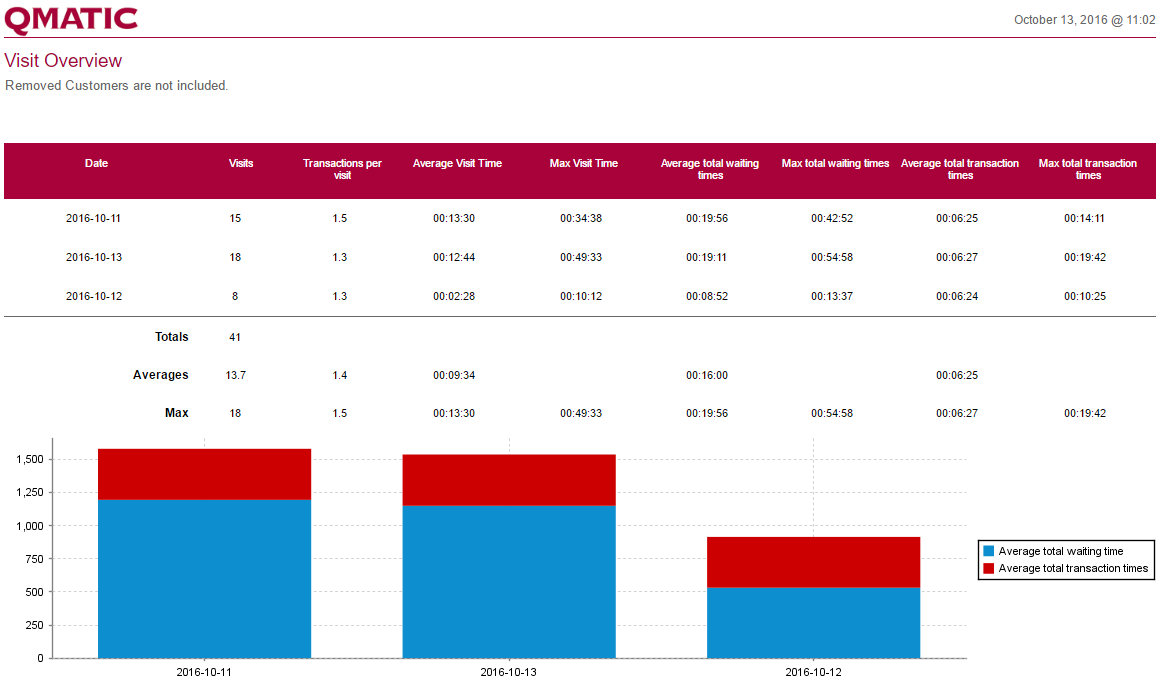
Month | Shows Day, Week, Month, Year or Weekday, depending on the View parameter. |
Visits | The number of Visits. |
Transaction per visit | The average number of transactions per Visit. |
Average Visit Time | The average Visit time per Visit. |
Average total waiting time | The average total waiting time per Visit. The total waiting time is the sum of all waiting times, during the Visit. |
Max total waiting time | The longest total waiting time for any Customer, during the period. |
Average total transaction time | The average total transaction time per Visit. The total transaction time is the sum of all transaction times, during the Visit. |
Max total transaction times | The longest total transaction time for any Customer during the period. |