Name | Definition |
|---|---|
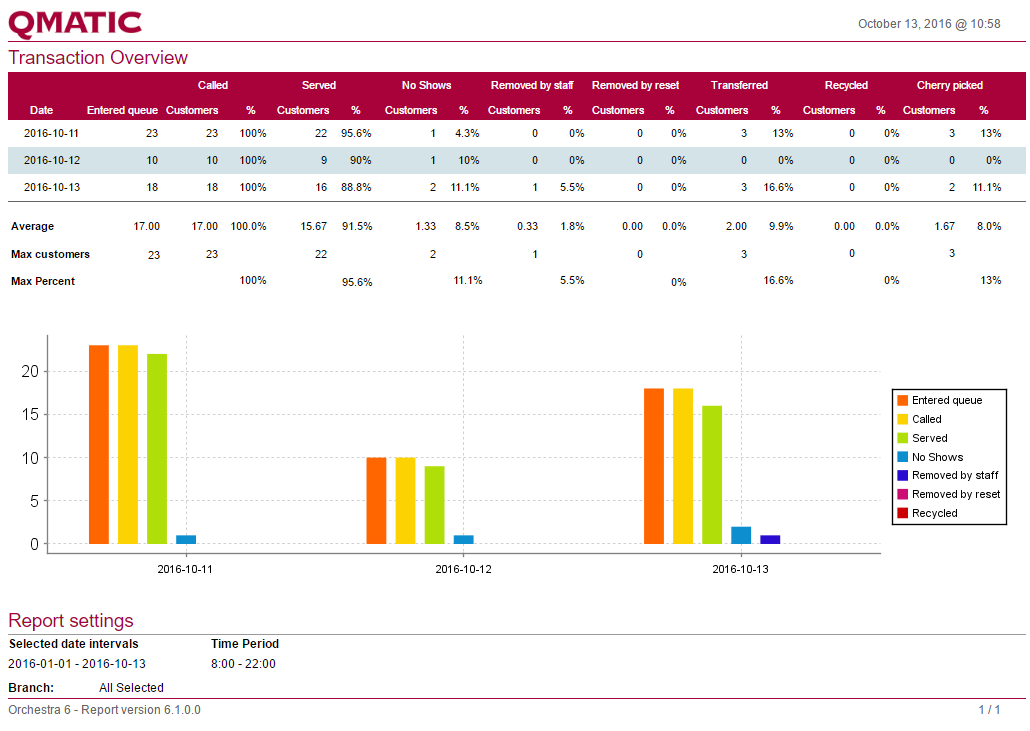
Date | Shows Day, Week, Month, Year or Weekday, depending on the View parameter. |
Entered queue | The number of Customers that entered a Queue, no matter if it is when a Visit is created or due to a transfer. |
Called Customers | The number of Customers that were called. |
Called % | The percentage of Customers that entered a Queue that were also called. |
Served Customers | The number of Customers that were served. |
Served % | The percentage of Customers that entered a Queue that were also served. |
No Shows Customers | The number of Customers that were no shows. |
No Shows % | The percentage of Customers that entered a Queue that were no shows. |
Removed by staff Customers | The number of waiting Customers that were removed by the staff. |
Removed by staff % | The percentage of Customers that entered a Queue that were removed by staff. |
Removed by reset Customers | The number of Customers that were removed by reset. |
Removed by reset % | The percentage of Customers that entered a Queue that were removed by reset. |
Transferred Customers | The number of Customers that were transferred to a Queue, Service Point pool or Staff pool. |
Transferred % | The percentage of Customers that entered a Queue that were transferred to a Queue, Service Point pool or Staff pool. |
Recycled | The number of Customers that were recycled. |
Recycled % | The percentage of Customers that entered a Queue that were recycled. |
Cherry picked | The number of Customers that were cherry picked. |
Cherry picked % | The percentage of Customers that entered a Queue that were cherry picked. |
Average | The average per period. |
Max customer | The maximum number of Customers in a column. |
Max Percent | The highest percentage in a column. Percentage is separated from the max Customers because they can occur in different periods (the period with the highest number of Customers may be different from the period with the highest percentage value). |
Average of average visit time | The average Visit time for all Visits. |