

Name | Definition |
|---|---|
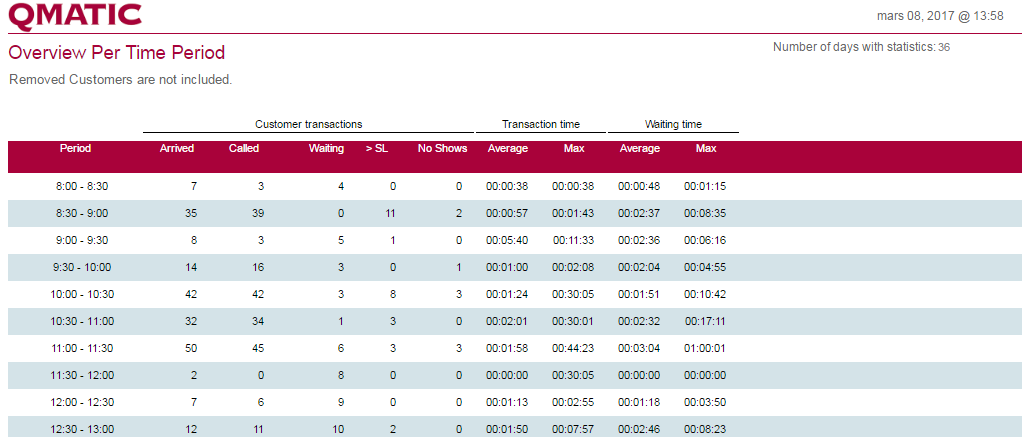
Period | The day is divided into periods. The period length is specified in the parameters. A period is from and including the start time and until but not including the end time. For 8:00-8:30 events that happened 8:00 are included in the report but events that happened exactly 08:30 are included in the next period. |
Arrived | Number of Customers that arrived during the period. |
Called | Number of Customers called during the period. |
Unserved in period | The Customers that were not served during the period. This includes unserved Customers from previous periods. For example, if 6 arrived and 4 are served there are 2 unserved Customers from that period into the next one. If 5 arrive and 6 are served there is still one unserved Customer from the previous period.This value is 0 if all Customers were served. |
Above service level | Customers that had a waiting time longer than the Service Level. |
No Shows | The number of no shows. |
Average transaction time | The average transaction time for all transactions that started during the period. |
Max transaction time | The longest transaction time for a transaction that started during the period. |
Average waiting time | The average waiting time for all transactions that started during the period. |
Max waiting time | The longest waiting time for a transaction that started during the period. |
Total arrived | The total number of Customers that arrived. |
Total called | The total number of Customers that were called. |
Total above service level | The total number of Customers that had a waiting time longer than the Service Level. |
Total no shows | The total number of no shows. |
Average of average transaction time | The average transaction time for all transactions included in the report. |
Average of average waiting time | The average waiting time for all Customers included in the report. |
Max arrived | The maximum number of Customers that arrived during one period. |
Max called | The maximum number of Customers that were called during a period. |
Max unserved customers | The maximum number of unserved Customers for one period. |
Max no shows | The maximum number of no shows for one period. |
Max average transaction time | The highest average transaction time for one period. |
Max of max transaction time | The longest transaction time for any transaction within the report. |
Max average waiting time | The highest average waiting time for a period. |
Max of max waiting time | The longest waiting time for any customer within the report. |