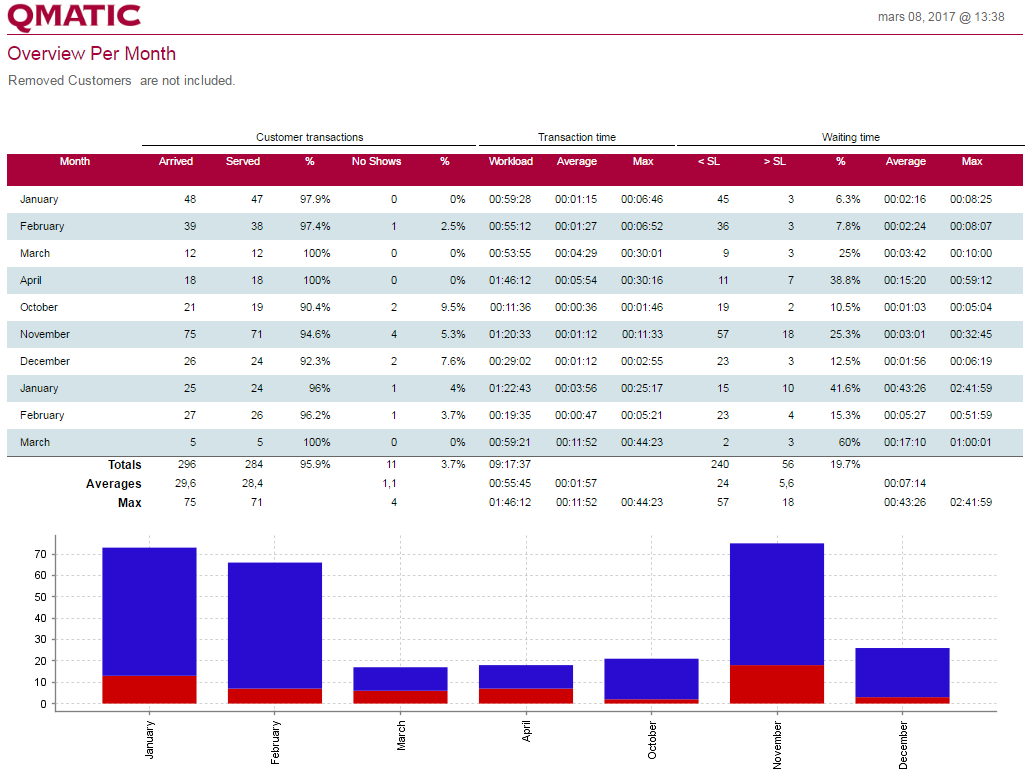

Name | Definition |
|---|---|
Date | Shows Day, Week, Month, Year or Weekday, depending on the View parameter. |
Arrived | Number of Customers that arrived. |
Served | Number of Customers that were served. |
% of arrived that were served | Percentage of the arrived Customers that were served. |
No Show | The number of no shows. |
% No Shows | Percentage of the arrived Customers that were no shows. |
Total Transaction Time | The total transaction time for all served Customers. |
Average Transaction Time | The average transaction time for all served Customers. |
Max Transaction Time | The longest transaction time within the period. |
Waiting time above KPI | The number of Customers that had a waiting time longer than the Service Level. |
% above KPI | Percent of all served customers that had a waiting time longer than the Service Level |
Average Waiting Time | The average waiting time for all called Customers. |
Max Waiting Time | The longest waiting time for a Customer. |
Total number of arrived | The total number of arrived Customers (the sum of the Arrived column. |
Total number of served | The total number of served Customers (The sum of the Served column) |
Total % of arrived that were served | The percentage of total number of arrived that also were served (total served / total arrived). |
Total number of no shows | The total number of no shows (The sum of the No Show column) |
Total % No Shows | The number of total no shows compared with the total number of arrived (total no shows / total arrived). |
Total of total transaction time | The total transaction time for all Customers served and included in this report. |
Total above KPI | The total number of Customers that had a waiting time longer than the KPI (Service Level). |
Average arrived | The average number of Customers that arrived per selected period. |
Average served | The average number of Customers that were served per selected period. |
Average no shows | The average number of no shows per selected period. |
Average total transaction time | The average total transaction time per selected period. |
Average of average transaction time | The average transaction time for all transactions included in the report. Note: not per selected period. |
Average above KPI | The average number of Customers, with a waiting time above the KPI, per selected period. |
Average of average waiting time | The average waiting time for all transactions included in the report. Note: not per selected period. |
Max arrived | The maximum number of arrived for a selected period. |
Max served | The maximum number of served Customers for a selected period. |
Max %served | The maximum percentage of served Customers for a selected period. |
Max no shows | The maximum number of no shows for a selected period. |
Max % no shows | The maximum percentage of no shows for a selected period. |
Max total transaction time | The maximum total transaction time for a selected period. |
Max average transaction time | The maximum average transaction time for a selected period. |
Max of max transaction time | The maximum max transaction time for a selected period. In reality, this is the longest transaction time for any Customer included in this report |
Max above KPI | The maximum number of waiting times above the KPI for a selected period. |
Max % above KPI | The maximum percentage of waiting times above the KPI for a selected period. |
Max average waiting time | The maximum average waiting time for a selected period. |
Max of max waiting time | The maximum max waiting time for a selected period. In reality this is the longest waiting time for any Customer included in this report |