Use report parameters to link Marks to the responses.
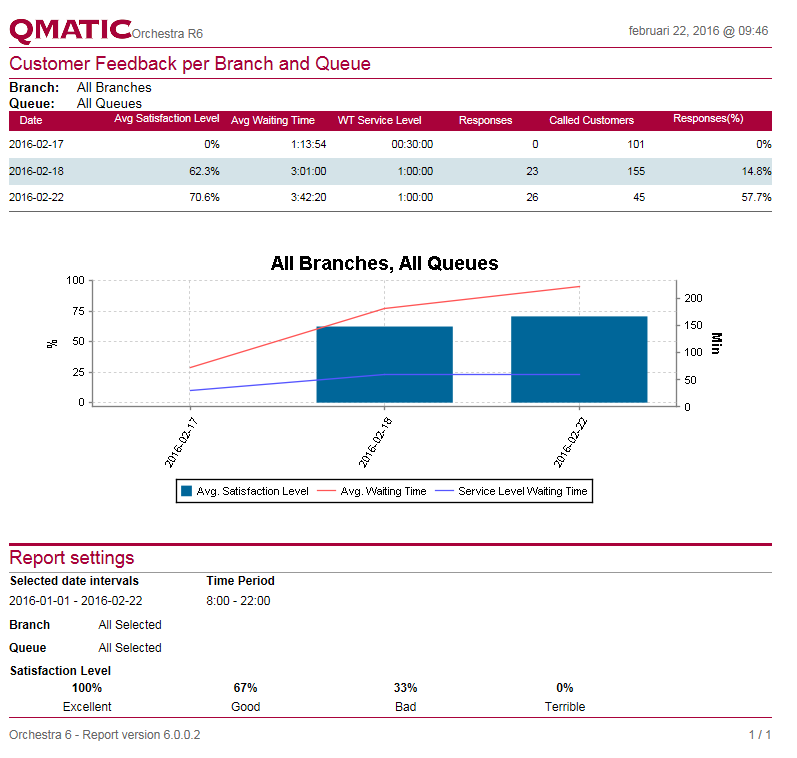
With this report, you can, for example, compare the Customer satisfaction level with the average waiting time. The result of the report can be used to fine-tune the Service level.
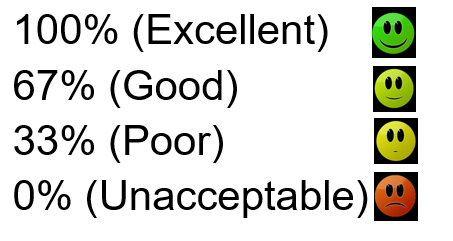
Satisfaction level is the average of the answers, where each answer is given a percentage value. Use report parameters to link Marks to the percentage values, as in the following example:
All data is combined from all the selected Branches and the report is displayed as one page per selected Queue.
The following data is shown:
Name
Definition
Date
Dates
Avg. Satisfaction Level
The average of all included answers (100, 67, 33, and 0).
Avg. Waiting Time
The average waiting time for all called Customers.