Name | Definition |
|---|---|
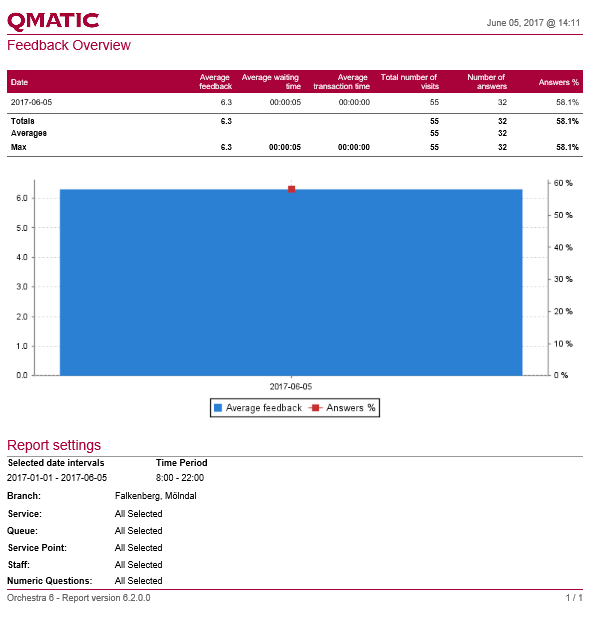
Date | Shows Day, Week, Month, Year, or Weekday, depending on the View parameter. |
Average feedback | The average of all the numeric feedbacks. |
Average waiting time | The average waiting time |
Average transaction time | The average transaction time |
Total number of visits | The total number of Visits |
Number of answers | The total number of answers |
Answer % | The percentage of the total number of Visits that provided an answer. Note: Each Visit is included only once, even if the Customer answered many questions. |